
Mark Hopkins

Research Question
Do arts organisations founded soon after the Massey Report (1951) receive disproportionately more government funding than younger organisations? If so, is this detrimental to EDIA- and justice-oriented organisations?
Photo by Marlowe Porter from the Thought Network Symposium
Photo by Marlowe Porter from the Thought Network Symposium
Mark Hopkins (he/him) is Co-Artistic Director of Swallow-a-Bicycle Theatre, which generates productive discomfort through art-making, and an Associate with Human Venture Leadership, which seeks to build our collective capacities to reduce ignorance, error, waste, suffering and injustice. Mark volunteers on the board of Kawalease Arab Canadian Theatre and founded We Should Know Each Other, a community-bridging initiative. He’s a Fellow with the Energy Futures Lab, and proud to be a contributing writer for the Energy Futures Print Portfolio and accompanying anthology, "Reimagining Fire: The Future of Energy", conceived and edited by Eveline Kolijn.
Modest, Almost Insignificant
Seventy-five years after the Massey Report, who gets Canada's arts funding?
by Mark Hopkins
(Last updated: Oct 9 26)
“Do arts organisations founded soon after the Massey Report (1951) receive disproportionately large amounts of government funding, compared to younger organisations? And, if so, is this detrimental to EDIA- and justice-oriented organisations?”
This was the research question that kicked off my work with Generator’s Thought Network research residency, and it emerged from… well, feeling stuck. I work at Swallow-a-Bicycle Theatre, a company that I co-founded in 2006. At twenty years old, we aren’t a scrappy young company anymore; we’re a well-established indie organisation. Even so, we’re in a constant struggle to pay our small, part-time staff a living wage – and, as I look around at peer organisations, it seems like they’re in the same boat. It feels like there’s a huge divide between us and the older artistic institutions, as though at some point between their founding and ours, arts funding fell off a cliff and never recovered.
After a few years of feeling stuck (and a couple of arguments with our provincial arts funder), I started to get more curious about this sense of funding inequity. This got me thinking about the “Royal Commission on National Development in the Arts, Letters and Sciences”, otherwise known as the Massey Commission, which investigated the state of arts and culture in Canada shortly after World War II. Its findings were published in the Massey Report in 1951, leading to the establishment of the Canada Council for the Arts and the National Library of Canada, and setting the stage for the arts infrastructure that surrounds us today. It marked a major step forward for public support for the arts in Canada, but it’s also worth looking at what it didn’t include: the models it drew upon came largely from Great Britain and France, and it was written at a time that Indigenous customs and culture were still outlawed in Canada. (The report’s legacy has been explored by, among others, Zainub Verjee and Mass Culture.)
I found myself wondering: was the Massey Report the last time that Canada heavily invested in the arts? And if so, given its Eurocentric and colonial viewpoint, what would that mean for arts organisations representing other cultures, traditions or values?
To explore those questions, I turned (as I often do) to data… and ended up making the most comprehensive spreadsheet of Canadian arts operating grant funding that exists. (At least, I think so! It would be really neat if someone else has done this work, but would also mean that I spent a lot of unnecessary hours on this project over the past few months.) I put together data for about 7,500 arts organisations across about 50 funding bodies, and (with the help of, ugh, AI) looked up all their founding years.
I chose to look at operating grants rather than project grants because, while project grants are typically one-off funding allotments for specific initiatives on a fixed timeline, operating grants represent reliable, unrestricted funding: predictable money that organisations can build upon. I chose to look at grants to organisations rather than individuals because it’s much easier and less intrusive to look up an organisation’s founding year than an artist’s birthdate, and funding trends over time are much more likely to be reflected in an organisation’s lifespan than an individual artist’s career.
Here’s what I found:
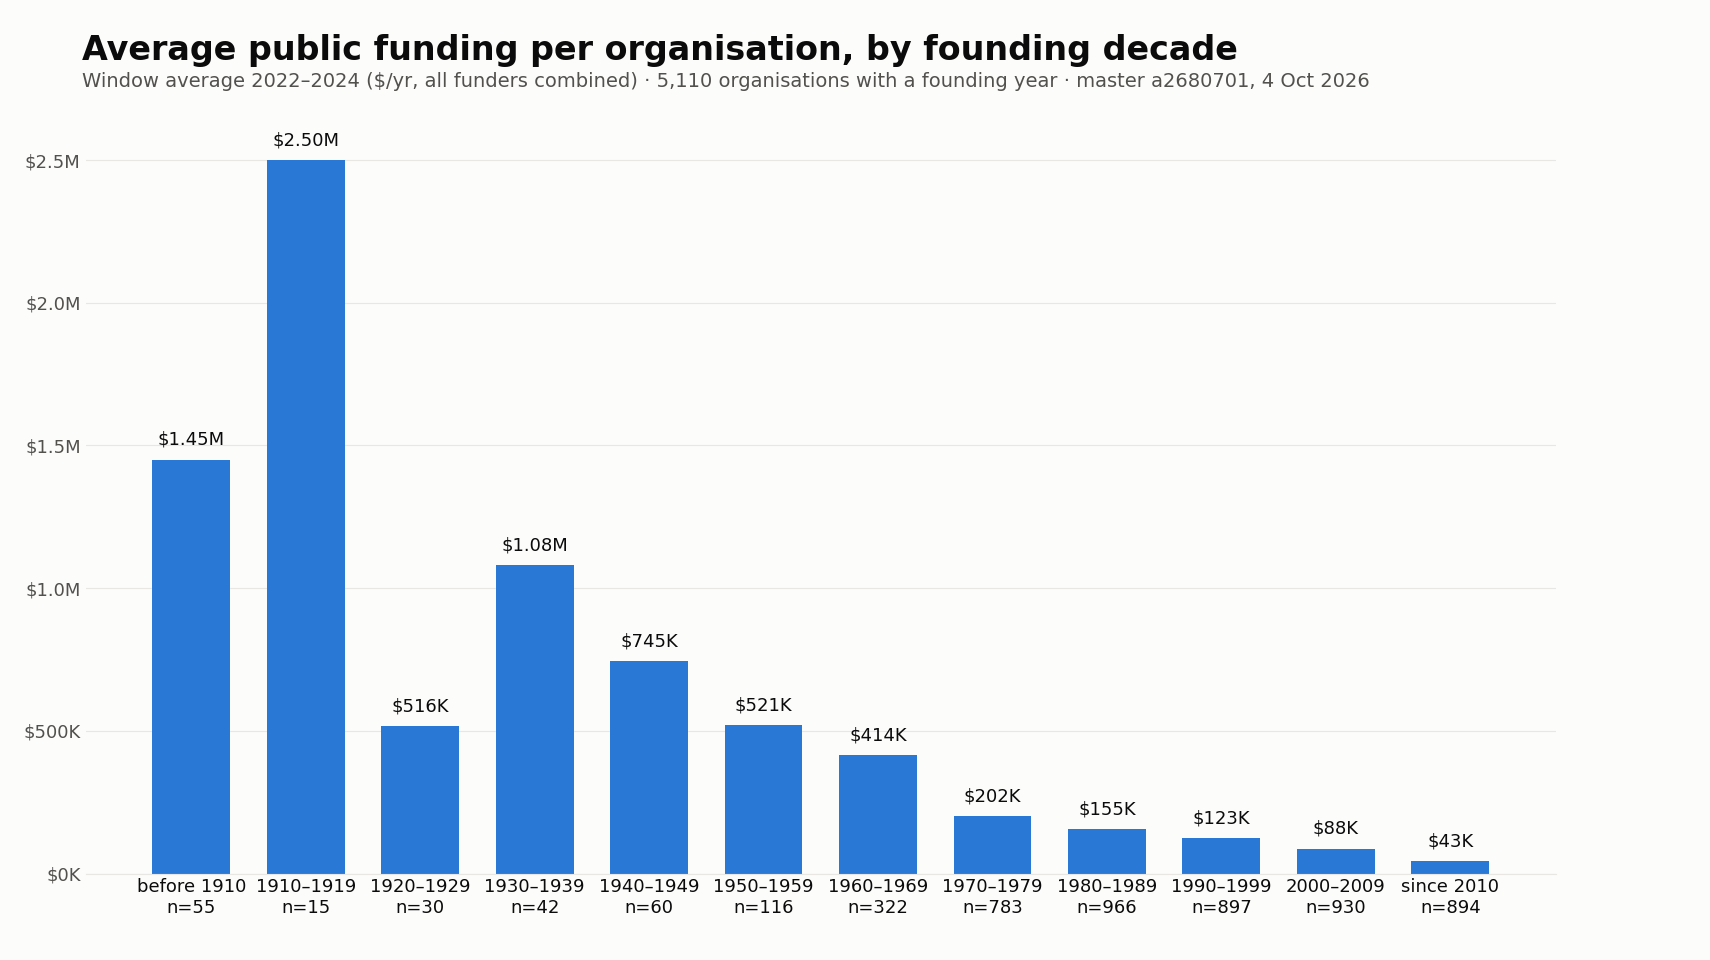
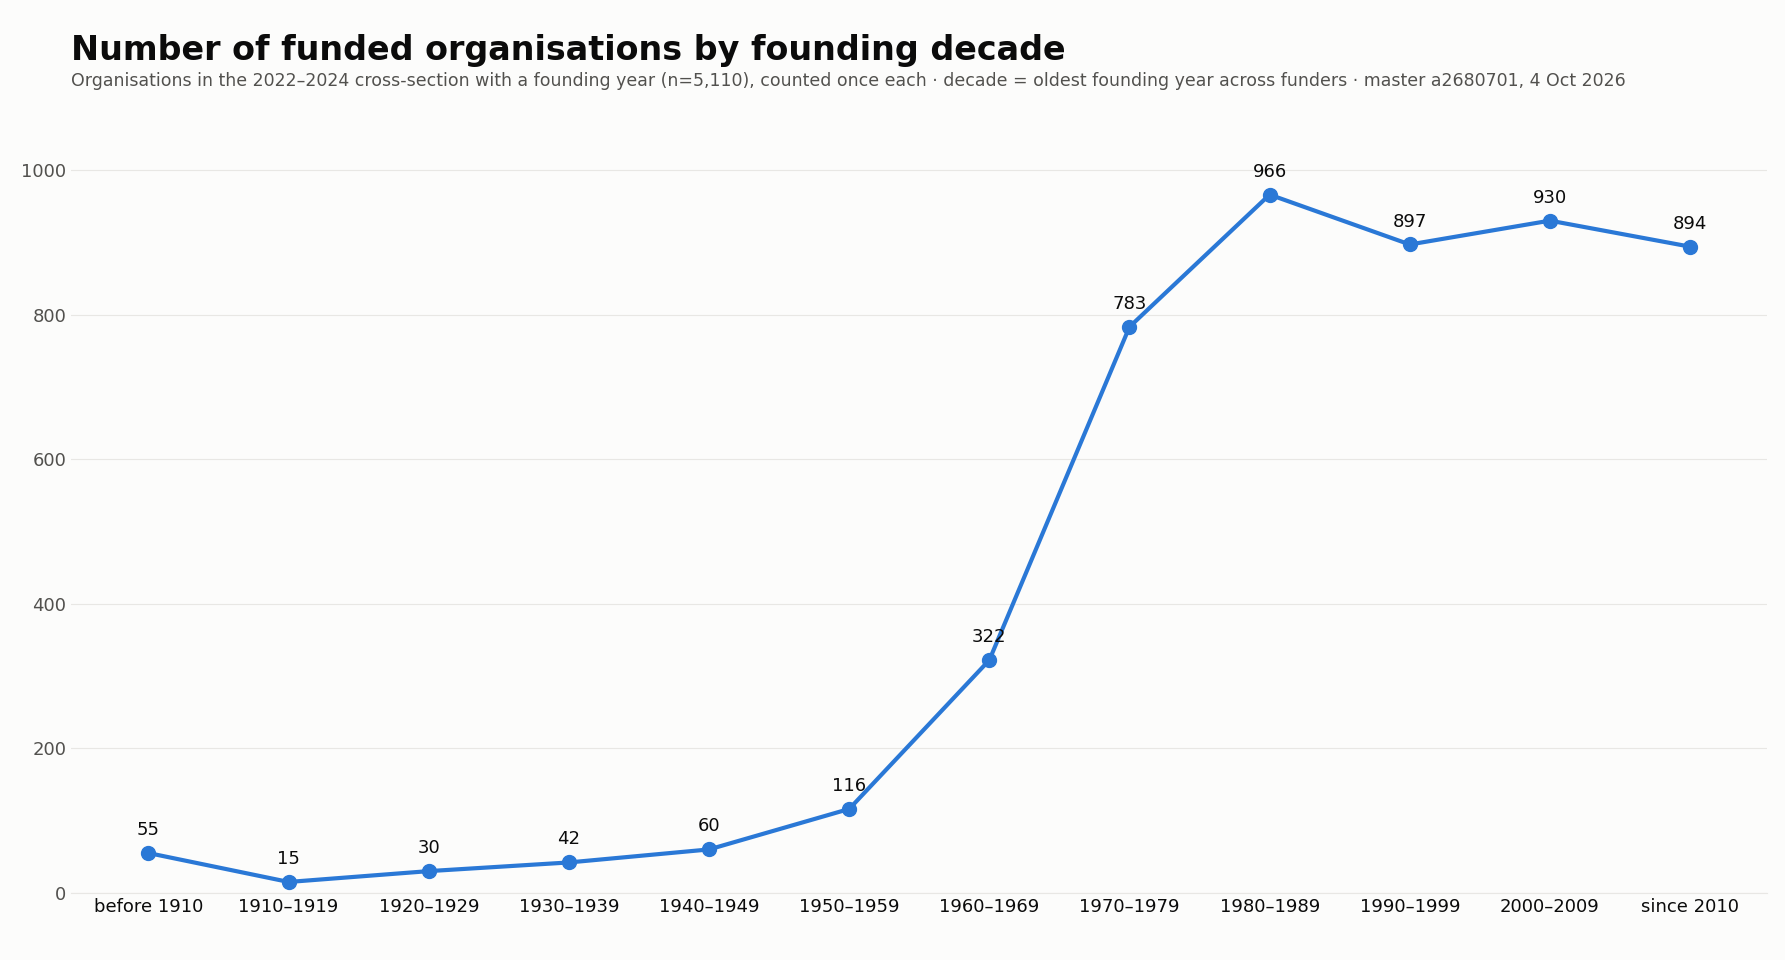
These graphs point to a big “Yes!” to the first question: organisations founded in the Massey Report era do indeed seem to receive disproportionately large amounts of government funding, compared to younger organisations. The first graph shows money (average operating grant for each founding decade), and the second one shows number of organisations per founding decade. Where there’s lots of money (organisations founded before 1970), there are very few organisations; where there are lots of organisations (those founded post-1970), there’s a lot less money.
When I dug deeper into the numbers, though, I found that the story is a bit more complicated. The age of an organisation doesn’t directly correlate to grant amount; there are 100+-year-old organisations getting about $2,000 per year, and organisations founded in the 2020s getting $100,000+ per year. It turns out that the pool of Canadian operating grants is dominated by a small group of elite organisations: the top-funded 146 orgs, mostly orchestras, operas, theatres, ballet companies, museums, art centres, national training schools and large festivals, just 2.8% of operating grant recipients, receive half of the roughly $960 million a year captured in this dataset (using averages from the 5,000+ organisations funded in 2022–24).
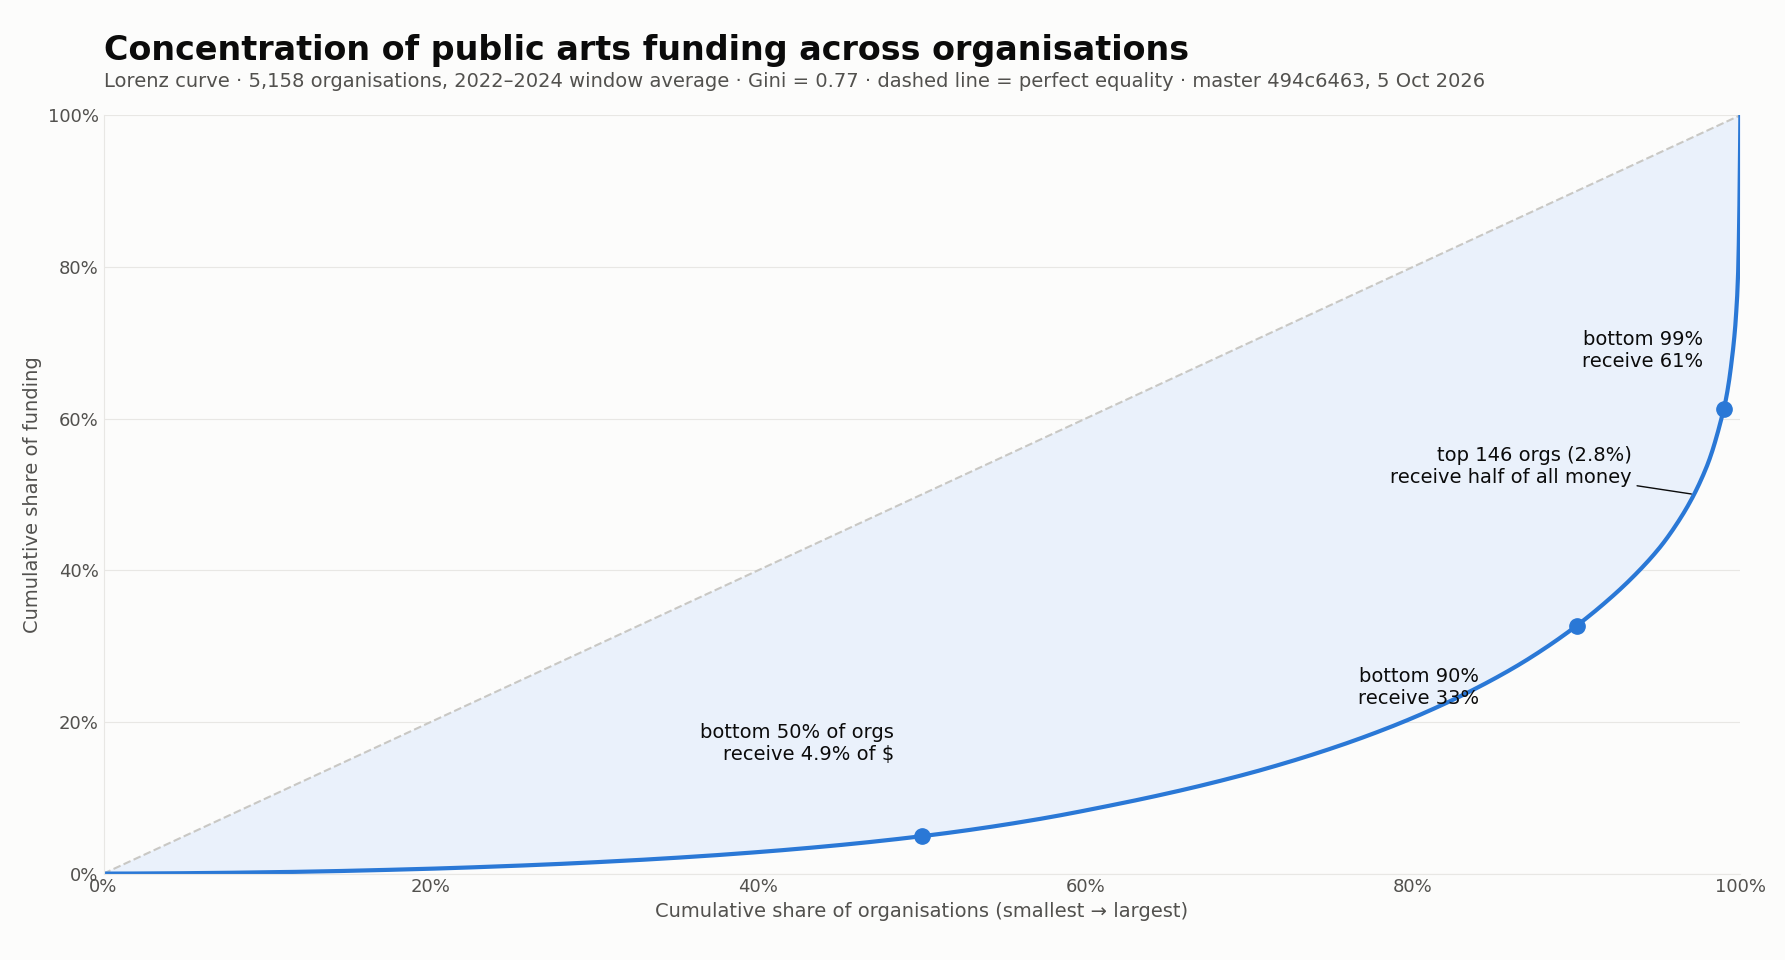
I’ll say that again: 2.8% of organisations get 50% of the money. And while there are a handful of equity-focused organisations in that group of top earners, the overwhelming majority – particularly the biggest recipients, with $1 million+ per year – represent art forms that originated in Western Europe.
Here’s the thing – I don’t begrudge the Orchestre Symphonique de Montréal (OSM, the best-funded organisation in Canadian competitive operating grant streams) its $11 million in operating funding per year. Running a symphonic orchestra is expensive, and I think it’s as deserving of public support as any other arts organisation. But should the OSM, one single organisation out of the more than five thousand funded in 2022-24, receive more than one cent of every public dollar?
Canada has seen significant injections of arts funding since the Massey Report; during the Pierre Trudeau era, in the 1960s and 1970s, the Canada Council's budget went from $1.9 million in 1965-66 (its first year of regular parliamentary funding) to $30.2 million in 1975-76, and many of the provincial arts funders got their start in that same time period. By the 1980s, though, for the most part, arts funding plateaued and has stagnated ever since. This impacts the entire Canadian arts ecosystem – including many of the largest organisations that haven’t had increases to their operating grants in years, which, with inflation, essentially amounts to a reduction. But the impacts are felt most keenly elsewhere: biases and systemic barriers facing equity-deserving arts leaders (IBPOC, queer/trans, disabled, etc.) meant that organisations led by and serving those communities were (for the most part) only able to start forming and seeking funding in the past few decades, and were therefore structurally excluded from those glory days of arts funding.
If I had my way, we’d see massive funding increases across the board: a new, generational investment that gave the largest organisations inflation-tracked increases, but that focuses mostly on lifting the vast sea of small- to mid-sized organisations to sustainable – actually, abundant levels of funding, with annual cost-of-living increases, and injections of major new investments every 5-10 years. While that might seem unachievable, it’s worth remembering something they wrote in the Massey Report: “If all our recommendations were accepted, the total figure might in isolation appear substantial; but in comparison with the costs of other activities of Government, it would be modest, almost insignificant.” That’s still the case: a transformational investment in the arts would be a drop in the bucket compared to the support that other sectors receive.
In the absence of that, though, we need to have a serious conversation about redistributing public funds and reducing both the concentration of grant money and the inequities it represents. Even as slightly greater shares of new money have gone to younger organisations in recent years, there’s a huge concentration of wealth in the largest institutions that has barely shifted.
According to my data, in 2024-25, OSM received $11,190,550 in operating funds and their overall budget was $39,058,151. Operating funds made up 29% of their budget. That’s a lot! If their operating funding disappeared, they would lose nearly a third of their budget. It would hurt. But they would still have an annual budget of nearly $28 million.
Similarly…
- The Banff Centre for Arts and Creativity’s $15,460,000 in 2024-25 operating grants and appropriations* is 25.5% of their $60,623,000 budget; they would have $45,163,000 without it.
- The National Ballet of Canada’s $6,792,533 in 2024 operating grants is 17% of their $40,432,000 budget; they would have about $33,639,000 without it.
*The Banff Centre is one of several large institutions that partially (or completely) sidestep the competitive granting system via direct relationships with one or several levels of government.
These numbers point to the different realities for the largest arts organisations, compared to the rest of the sector: their size allows them to access a far more diverse range of revenues, like philanthropic donations, private foundations (sometimes linked directly and exclusively to the arts organisation!), capital investments from the government, corporate sponsors, ticket revenue and more. By contrast, smaller organisations often have less access to these income sources and rely more on operating grants.
· Buddies in Bad Times received $714,696 in 2024 operating grants, 59% of their $1,210,146 budget.
· Black Theatre Workshop* received $525,000 in 2024 operating grants, 55% of their $961,912 budget.
· Cahoots Theatre received $246,795 in 2024 operating grants, 69% of its $355,488 budget.
· Sâkêwêwak Artists' Collective received $210,160 in 2024 operating grants, 62% of its $340,020 budget.
· Chromatic Theatre* received $122,007.25 in 2025 operating grants, 86% of its $142,585.00 budget.
· Swallow-a-Bicycle Theatre*, the organisation I work for, received $122,888.65 in operating grants in 2024-25, representing 52% of our $237,137.29 budget.
*These organisations each receive a grant that’s on a multi-year cycle; I did my best to correctly represent how the organisations themselves allocated the funding. It’s also worth noting that the lion’s share of the two Alberta-based organisations’ operating grant funding comes from our province’s unique, bizarre and somewhat morally compromising volunteer casino fundraising system; without that, Chromatic Theatre and Swallow-a-Bicycle Theatre’s budgets would drop by $89,637 and $79,972.65, respectively.
These are still relatively large organisations within the small- to mid-sized bucket, but it’s harder to find financial statements for the smaller organisations. Even so, with operating grants making up between 52% to 86% of their overall revenues for these groups, their challenges accessing diversified revenues, and their reliance on operating grants, is clear.
An actual redistribution probably wouldn’t mean stripping the largest recipients of all their operating funds, but even a small reallocation could be transformative for the less-funded 97.2%, not to mention the countless arts groups that haven’t been able to access operating funding at all. One possible intervention could be the arts version of this viral post:

Up to the first, say, $500,000 of operating funding, nothing happens… but after that, an increasing percentage gets reallocated back into the funding pool, starting at 5% and rising to 30% on the portion above $10 million, and capped so that no institution loses more than 5% of its total revenues, phased over three years. This would free up roughly $40 to $55 million a year from about 250 organisations. This could translate into a $30,000 operating minimum for every funded organisation, plus a few hundred grants designed to help small companies reach a second funder, which would roughly double public investment for the bottom half of the sector. This would move two thousand organisations from surviving on meagre grants to working with $30,000 a year, while organisations like the National Arts Centre and the National Gallery (the arts organisations that receive the most public funds in Canada, entirely through appropriations) absorb a change smaller than the real-terms cut that inflation has already quietly imposed on most large grant recipients.
At the end of that three-year intervention, what next? I don’t know – maybe institute a maximum annual funding cap, rising only with inflation, and/or use some of the reallocated funding to start a foundation dedicated to funding small- to mid-sized organisations? Something would need to happen, otherwise the same inequities would very likely re-emerge after the intervention wrapped up. And reallocation can be a partial solution, but I’m still convinced that we aren’t going to see the changes that are most needed without major new investment, rather than just shuffling the existing money around.
Those are some of the interventions I dreamed up. Artists, arts producers, funders – when you look at this dataset, what are your ideas?
Coming back to my original questions – is this system detrimental to EDIA- and justice-oriented organisations? Hell yes. There are some bright spots: for instance, it seems like equity-mandated organisations’ funding has grown faster than everyone else’s since 2015, at most funders, which may represent some baby steps toward correcting historic inequities. But faster percentage growth on grant amounts that were initially tiny leads to still-tiny amounts, while the frozen half of public money going to the top 177 orgs stays in place.
The very fact that more than five thousand arts organisations across the country are receiving (reasonably) reliable, stable, flexible funding to support their work is pretty damn cool. But this dataset also shows that our funding system is held back by inertia, and that it privileges a small group of major institutions. Operating grants are renewed year after year at the same dollar amounts, and the doors into the top funding tiers have mostly rusted shut. The hierarchy of 1980 is, with few exceptions, the hierarchy of today.
At the very least, for anyone running an organisation that was founded after 1980 and who’s been feeling stuck, I hope this dataset confirms that it’s not all in your head. But I hope we can go further than that. Data can be power. Now that these numbers are all compiled together in a single document, maybe we can use them to spark some change. A “modest, almost insignificant” investment, like the one Canada made in the 1950s, can make a huge difference. Let’s try to make it happen.
About the data
The full spreadsheet, with all the data I’ve collected, can be found here: Arts_Operating_Funding_in_Canada
I compiled this dataset of operating grants (and their equivalents, like base operating appropriations, gaming programs and other recurring public funding) from 53 operating-funding streams from 51 public funders — federal, provincial, territorial and municipal — to about 7,500 Canadian arts organisations, roughly 5,200 of which were funded in 2022–24. It covers operating funding only: project grants, capital funding, COVID emergency programs and in-kind support are excluded, because I wanted to measure the reliable, unrestricted money that organisations can build on. Everything comes from public sources - funders' published recipient lists, annual reports and open-data disclosures - and each organisation is tracked across funders so that, for example, a company funded by the Canada Council, a provincial arts council and a city shows up once, not three times.
The "2022–24" figures referenced in this essay are averages rather than a single year, because several funders pay on multi-year cycles and any single year undercounts them. A few funders' published figures are amounts paid to date rather than full awards, so their totals are slightly conservative. I looked up the founding years of each organisation individually (with the help of Claude, Anthropic's AI assistant) and found the budget comparisons for the largest institutions in their own audited financial statements, annual reports, or CRA charity returns. No dataset like this is perfect: funders publish differently, some municipalities aren't captured, and any errors in assembling it are mine. If you spot one, or make any discoveries while digging into the dataset, I'd love to hear from you! Feel free to reach out to me at mark.c.hopkins@gmail.com.